The calculation of the electricity production from a photovoltaic station begins with the collection of the available solar radiation data. Since the geographical variation of the available solar radiation is not very intensive (compared, for example, to the wind potential), solar radiation data can be gathered from meteorological stations or academic and research institutes and be used with adequate reliability. Characteristic solar radiation data are presented in table 1 for the town of Heraklion, Crete, Greece. These data can be used for a broader geographical territory around the measurements station’s location.
|
Table 1: Solar radiation measurements for the town of Heraklion, Crete, Greece (35ο20΄, 25ο11΄). |
||||||
|
Month |
Sunlight |
Averaged |
Total solar |
Total solar |
Total solar |
Total solar |
|
January |
108.8 |
12.2 |
67 |
70 |
73 |
72 |
|
February |
128.4 |
12.5 |
83 |
88 |
90 |
87 |
|
March |
170.3 |
13.8 |
125 |
131 |
129 |
121 |
|
April |
234.5 |
16.8 |
162 |
160 |
152 |
136 |
|
May |
314.3 |
20.8 |
214 |
195 |
177 |
150 |
|
June |
353.3 |
24.4 |
230 |
199 |
175 |
143 |
|
July |
384.7 |
26.4 |
249 |
215 |
190 |
156 |
|
August |
356.7 |
26.3 |
221 |
207 |
191 |
164 |
|
September |
285.2 |
23.7 |
174 |
178 |
172 |
157 |
|
October |
197.2 |
20.3 |
114 |
130 |
131 |
126 |
|
November |
161.5 |
17.1 |
82 |
97 |
101 |
100 |
|
December |
121.1 |
13.9 |
65 |
75 |
79 |
79 |
|
Total / Averaged |
2,816.0 |
19.0 |
149 |
145 |
138 |
124 |
A graphical representation of the solar radiation data presented in table 1 is provided in figure 1.
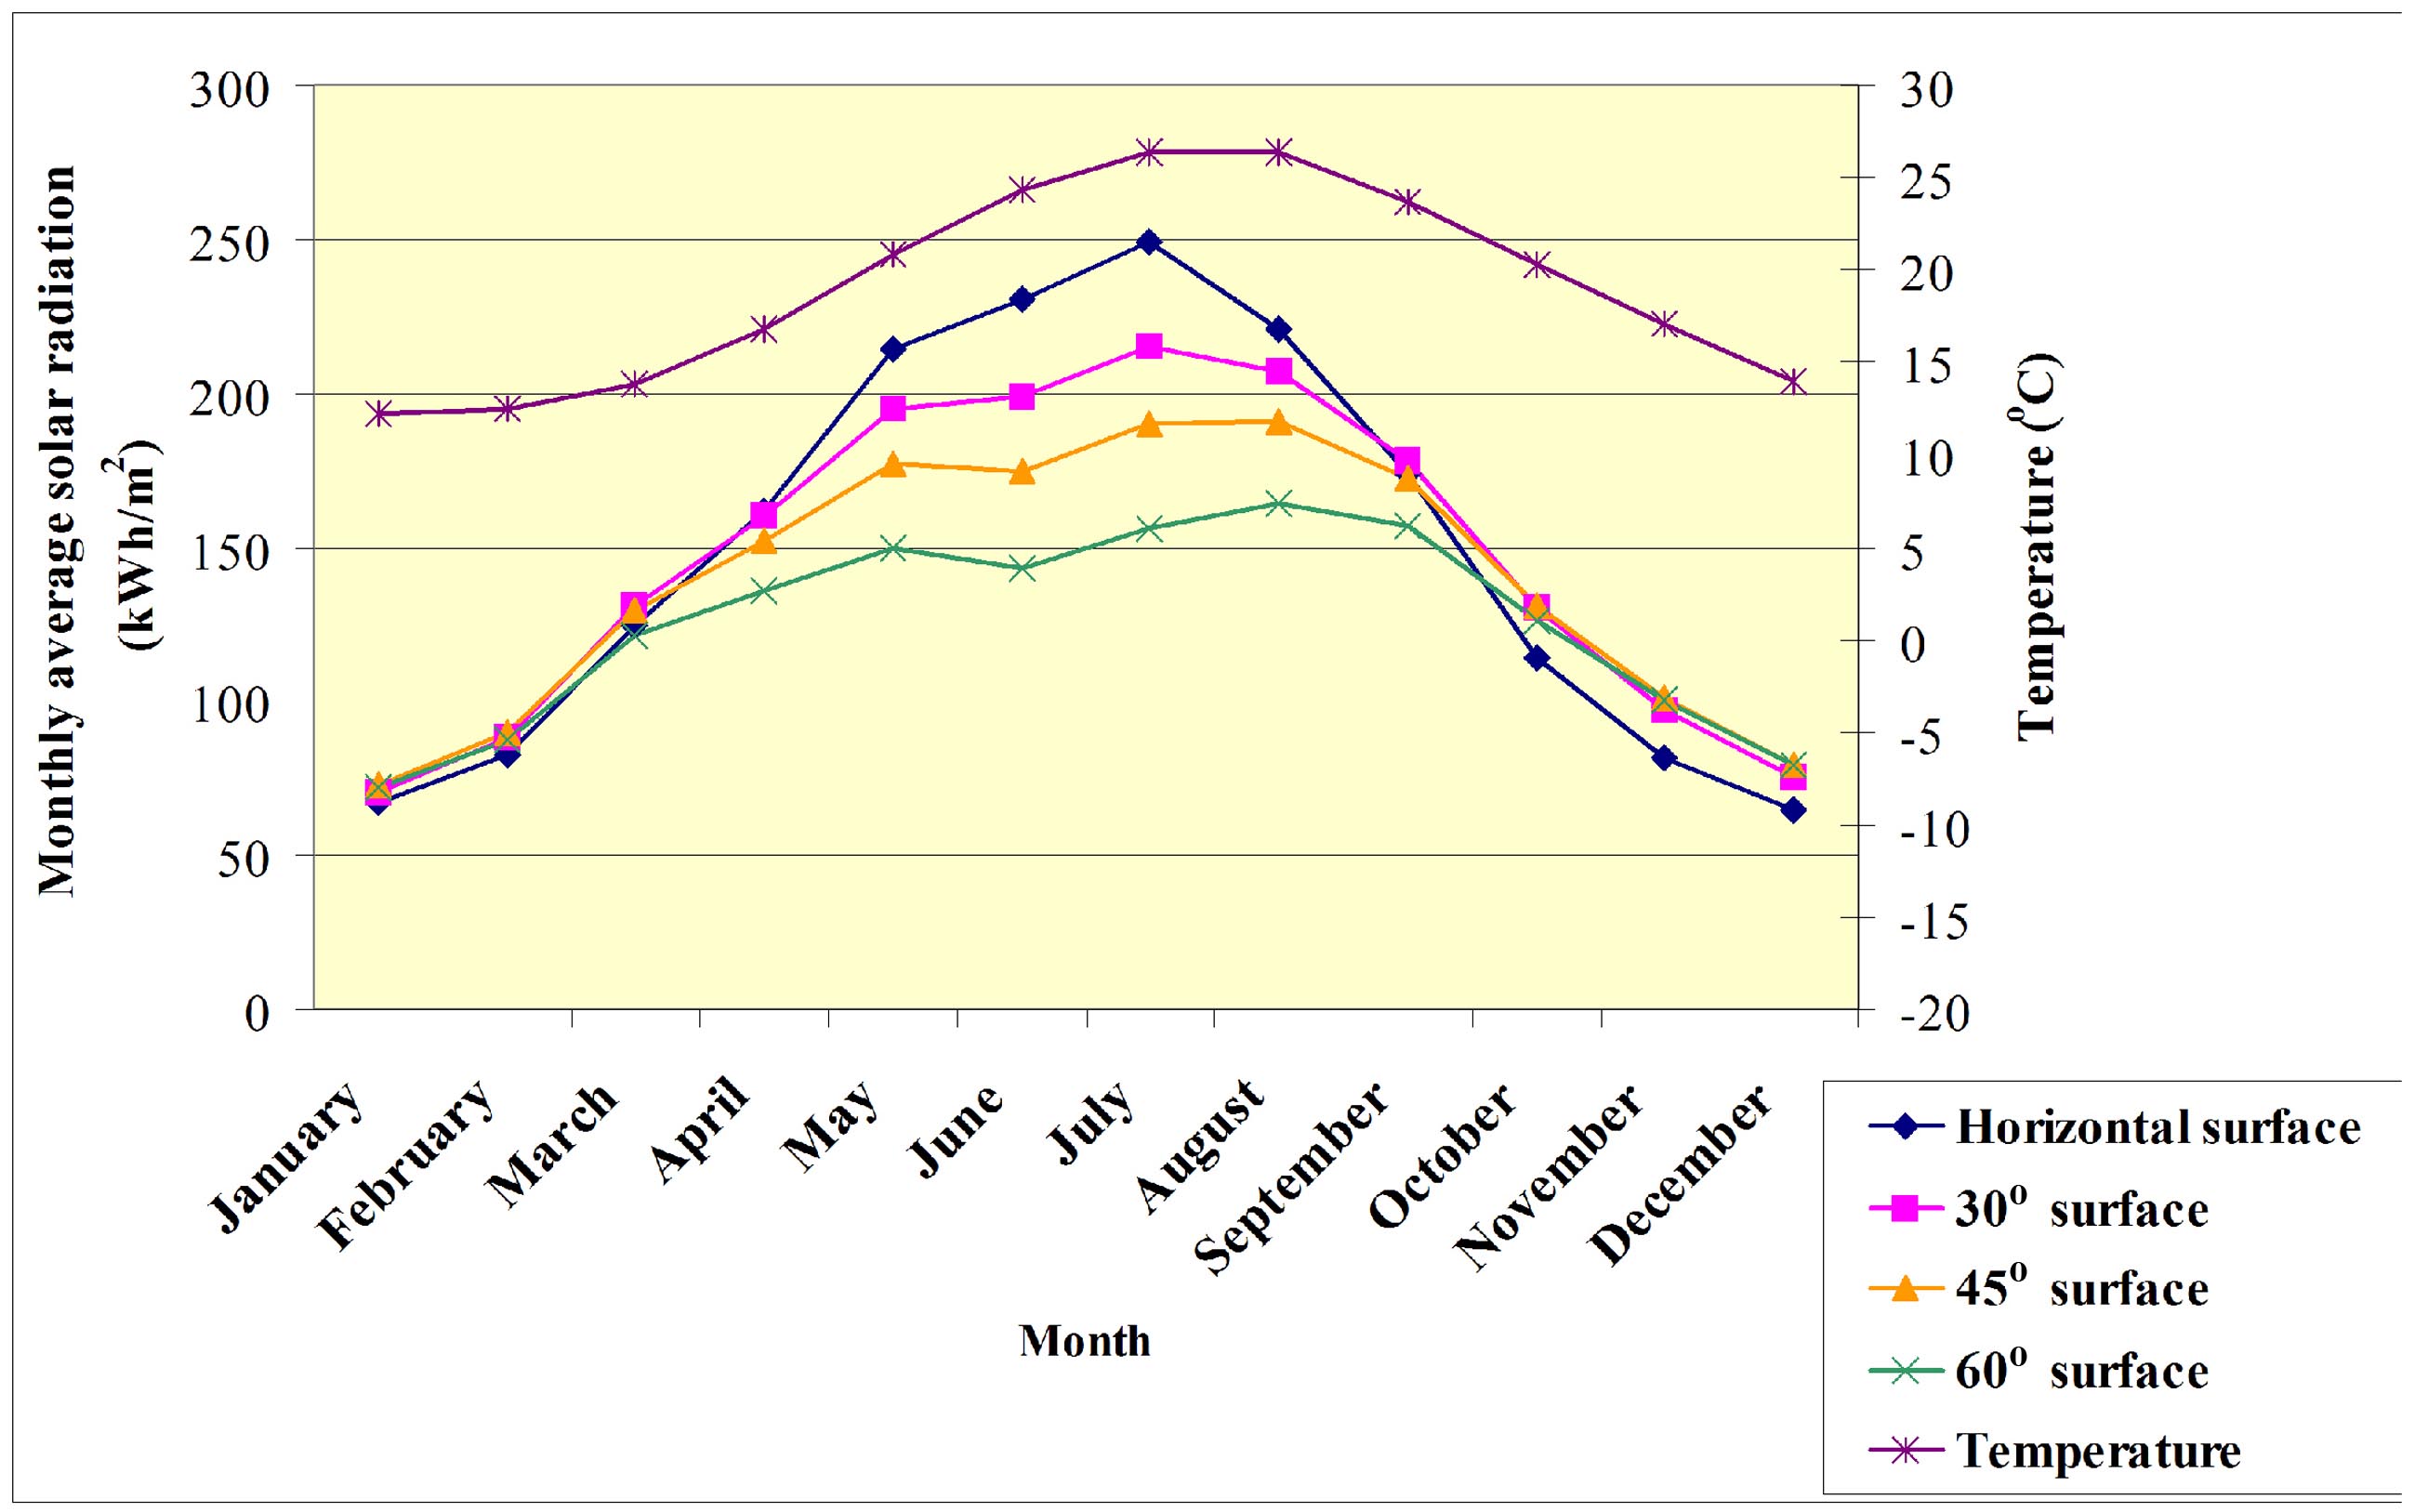
Figure 1: Total monthly solar irradiation and ambient temperature annual variation for the town of Heraklion, Crete, Greece.
Given the monthly available solar radiation data, the power production calculation procedure will be presented below on a monthly calculation step. Obviously, the same methodology can be respectively applied with different calculation time steps, in case the solar radiation data are available with higher time discrimination.
The power production from a photovoltaic station is given by the following relationship:

where:
From the above relationship it is revealed that the calculation of the photovoltaic station power production is subject to the calculation of photovoltaic station’s power coefficient cP/V.
The photovoltaic station’s power coefficient is given by the following relationship:
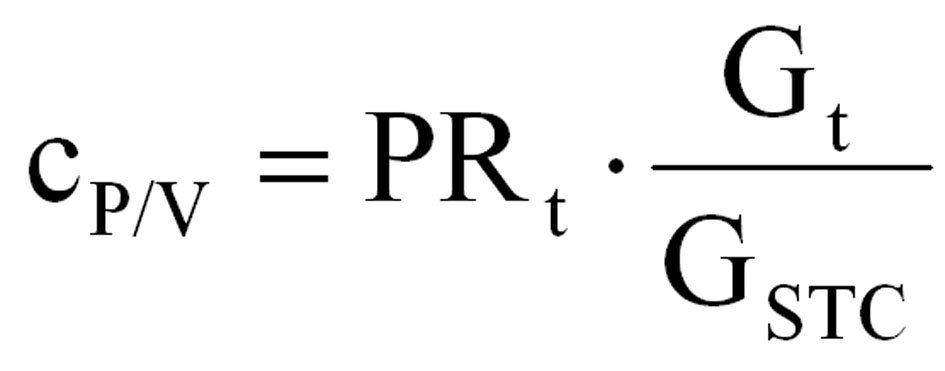
where:
The solar irradiance is given by the following relationship:
where:
The overall efficiency of the photovoltaic station is given by the following product:

where
The efficiency PRT is given by the following relationship:

where:
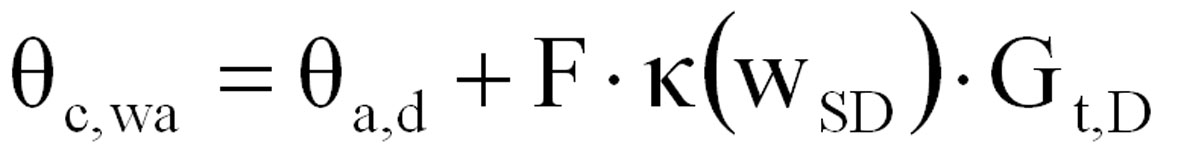
where:
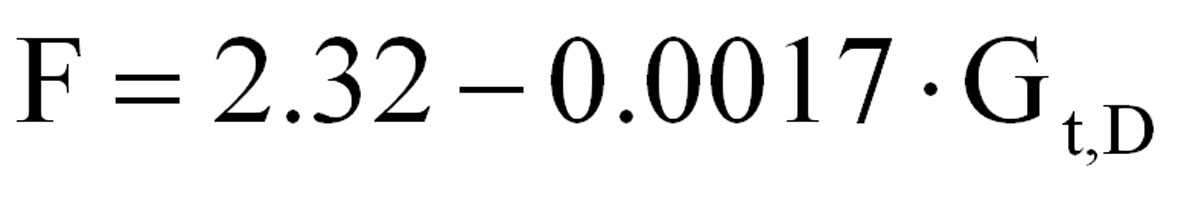
where:
where:
where:
Except from PRT, characteristic values for the rest efficiencies of a photovoltaic station are present below:
The power production from a photovoltaic station is calculation following the relationships presented previously. A step-by-step analytical example is provided in the following tables 2 for a photovoltaic station of 10kW nominal power installed in Heraklion, Crete, Greece.
|
Table 2a: Power production calculation from a photovoltaic station of 10kW nominal power, installed in Heraklion, Crete, Greece. |
||||||
|
Month |
Days number |
Solar irradiation Ht (kWh/m2) |
Installation inclination (ο) |
Ambinet temperature θa,D (oC) |
Solar irradiance Gt (W/m2) |
Daytime time percentage ad |
|
January |
31 |
73.00 |
45.00 |
12.20 |
98.12 |
0.41 |
|
February |
28 |
90.00 |
45.00 |
12.50 |
133.93 |
0.45 |
|
March |
31 |
131.00 |
30.00 |
13.80 |
176.08 |
0.48 |
|
April |
30 |
162.00 |
0.00 |
16.80 |
225.00 |
0.53 |
|
May |
31 |
213.90 |
0.00 |
20.80 |
287.50 |
0.55 |
|
June |
30 |
230.10 |
0.00 |
24.40 |
319.58 |
0.58 |
|
July |
31 |
248.93 |
0.00 |
26.40 |
334.58 |
0.58 |
|
August |
31 |
221.03 |
0.00 |
26.30 |
297.08 |
0.56 |
|
September |
30 |
178.00 |
30.00 |
23.70 |
247.22 |
0.53 |
|
October |
31 |
130.00 |
30.00 |
20.30 |
174.73 |
0.49 |
|
November |
30 |
101.00 |
45.00 |
17.10 |
140.28 |
0.45 |
|
December |
31 |
79.00 |
45.00 |
13.90 |
106.18 |
0.40 |
|
|
Total: |
1,857.96 |
Average: |
19.02 |
|
|
|
Table 2b: Power production calculation from a photovoltaic station of 10kW nominal power, installed in Heraklion, Crete, Greece. |
|||||
|
Month |
Solar irradiance Gt,d (W/m2) |
Parameter F |
Wind velocity wsd (m/sec) |
Thermal resistance κ(wsd) (οC/(W.m2)) |
Cell’s temperature θc,wa (oC) |
|
January |
239.31 |
1.91 |
3.80 |
0.0229 |
22.68 |
|
February |
297.62 |
1.81 |
4.00 |
0.0225 |
24.67 |
|
March |
366.82 |
1.70 |
4.00 |
0.0225 |
27.82 |
|
April |
424.53 |
1.60 |
3.40 |
0.0237 |
32.87 |
|
May |
522.73 |
1.43 |
2.30 |
0.0262 |
40.43 |
|
June |
551.01 |
1.38 |
3.00 |
0.0245 |
43.10 |
|
July |
576.87 |
1.34 |
4.00 |
0.0225 |
43.81 |
|
August |
530.51 |
1.42 |
4.00 |
0.0225 |
43.25 |
|
September |
466.46 |
1.53 |
3.40 |
0.0237 |
40.57 |
|
October |
356.59 |
1.71 |
3.20 |
0.0241 |
35.03 |
|
November |
311.73 |
1.79 |
3.00 |
0.0245 |
30.79 |
|
December |
265.46 |
1.87 |
4.00 |
0.0225 |
25.08 |
|
Table 2c: Power production calculation from a photovoltaic station of 10kW nominal power, installed in Heraklion, Crete, Greece. |
||||||
|
Month |
PRΤ |
Overall efficiency PRt |
Power coefficient cP/V |
Power production PP/V (kW) |
Electricity production EP/V (kWh) |
Capacity factor (%) |
|
January |
1.0104 |
0.8754 |
0.0859 |
0.86 |
639.06 |
8.59 |
|
February |
1.0015 |
0.8677 |
0.1162 |
1.16 |
780.93 |
11.62 |
|
March |
0.9873 |
0.8554 |
0.1506 |
1.51 |
1,120.57 |
15.06 |
|
April |
0.9646 |
0.8357 |
0.1880 |
1.88 |
1,353.86 |
18.80 |
|
May |
0.9306 |
0.8062 |
0.2318 |
2.32 |
1,724.55 |
23.18 |
|
June |
0.9185 |
0.7958 |
0.2543 |
2.54 |
1,831.17 |
25.43 |
|
July |
0.9154 |
0.7931 |
0.2653 |
2.65 |
1,974.18 |
26.53 |
|
August |
0.9179 |
0.7952 |
0.2363 |
2.36 |
1,757.72 |
23.63 |
|
September |
0.9299 |
0.8057 |
0.1992 |
1.99 |
1,434.15 |
19.92 |
|
October |
0.9549 |
0.8273 |
0.1446 |
1.45 |
1,075.49 |
14.46 |
|
November |
0.9739 |
0.8438 |
0.1184 |
1.18 |
852.25 |
11.84 |
|
December |
0.9997 |
0.8661 |
0.0920 |
0.92 |
684.22 |
9.20 |
|
|
|
|
Total / Average: |
15,228.16 |
17.38 |
|
The annual electricity production calculation is integrated with the presentation of the following diagrams:
Figure 2: Annual variation of the available solar irradiance.
Figure 3: Annual variation of the photovoltaic station’s efficiencies.
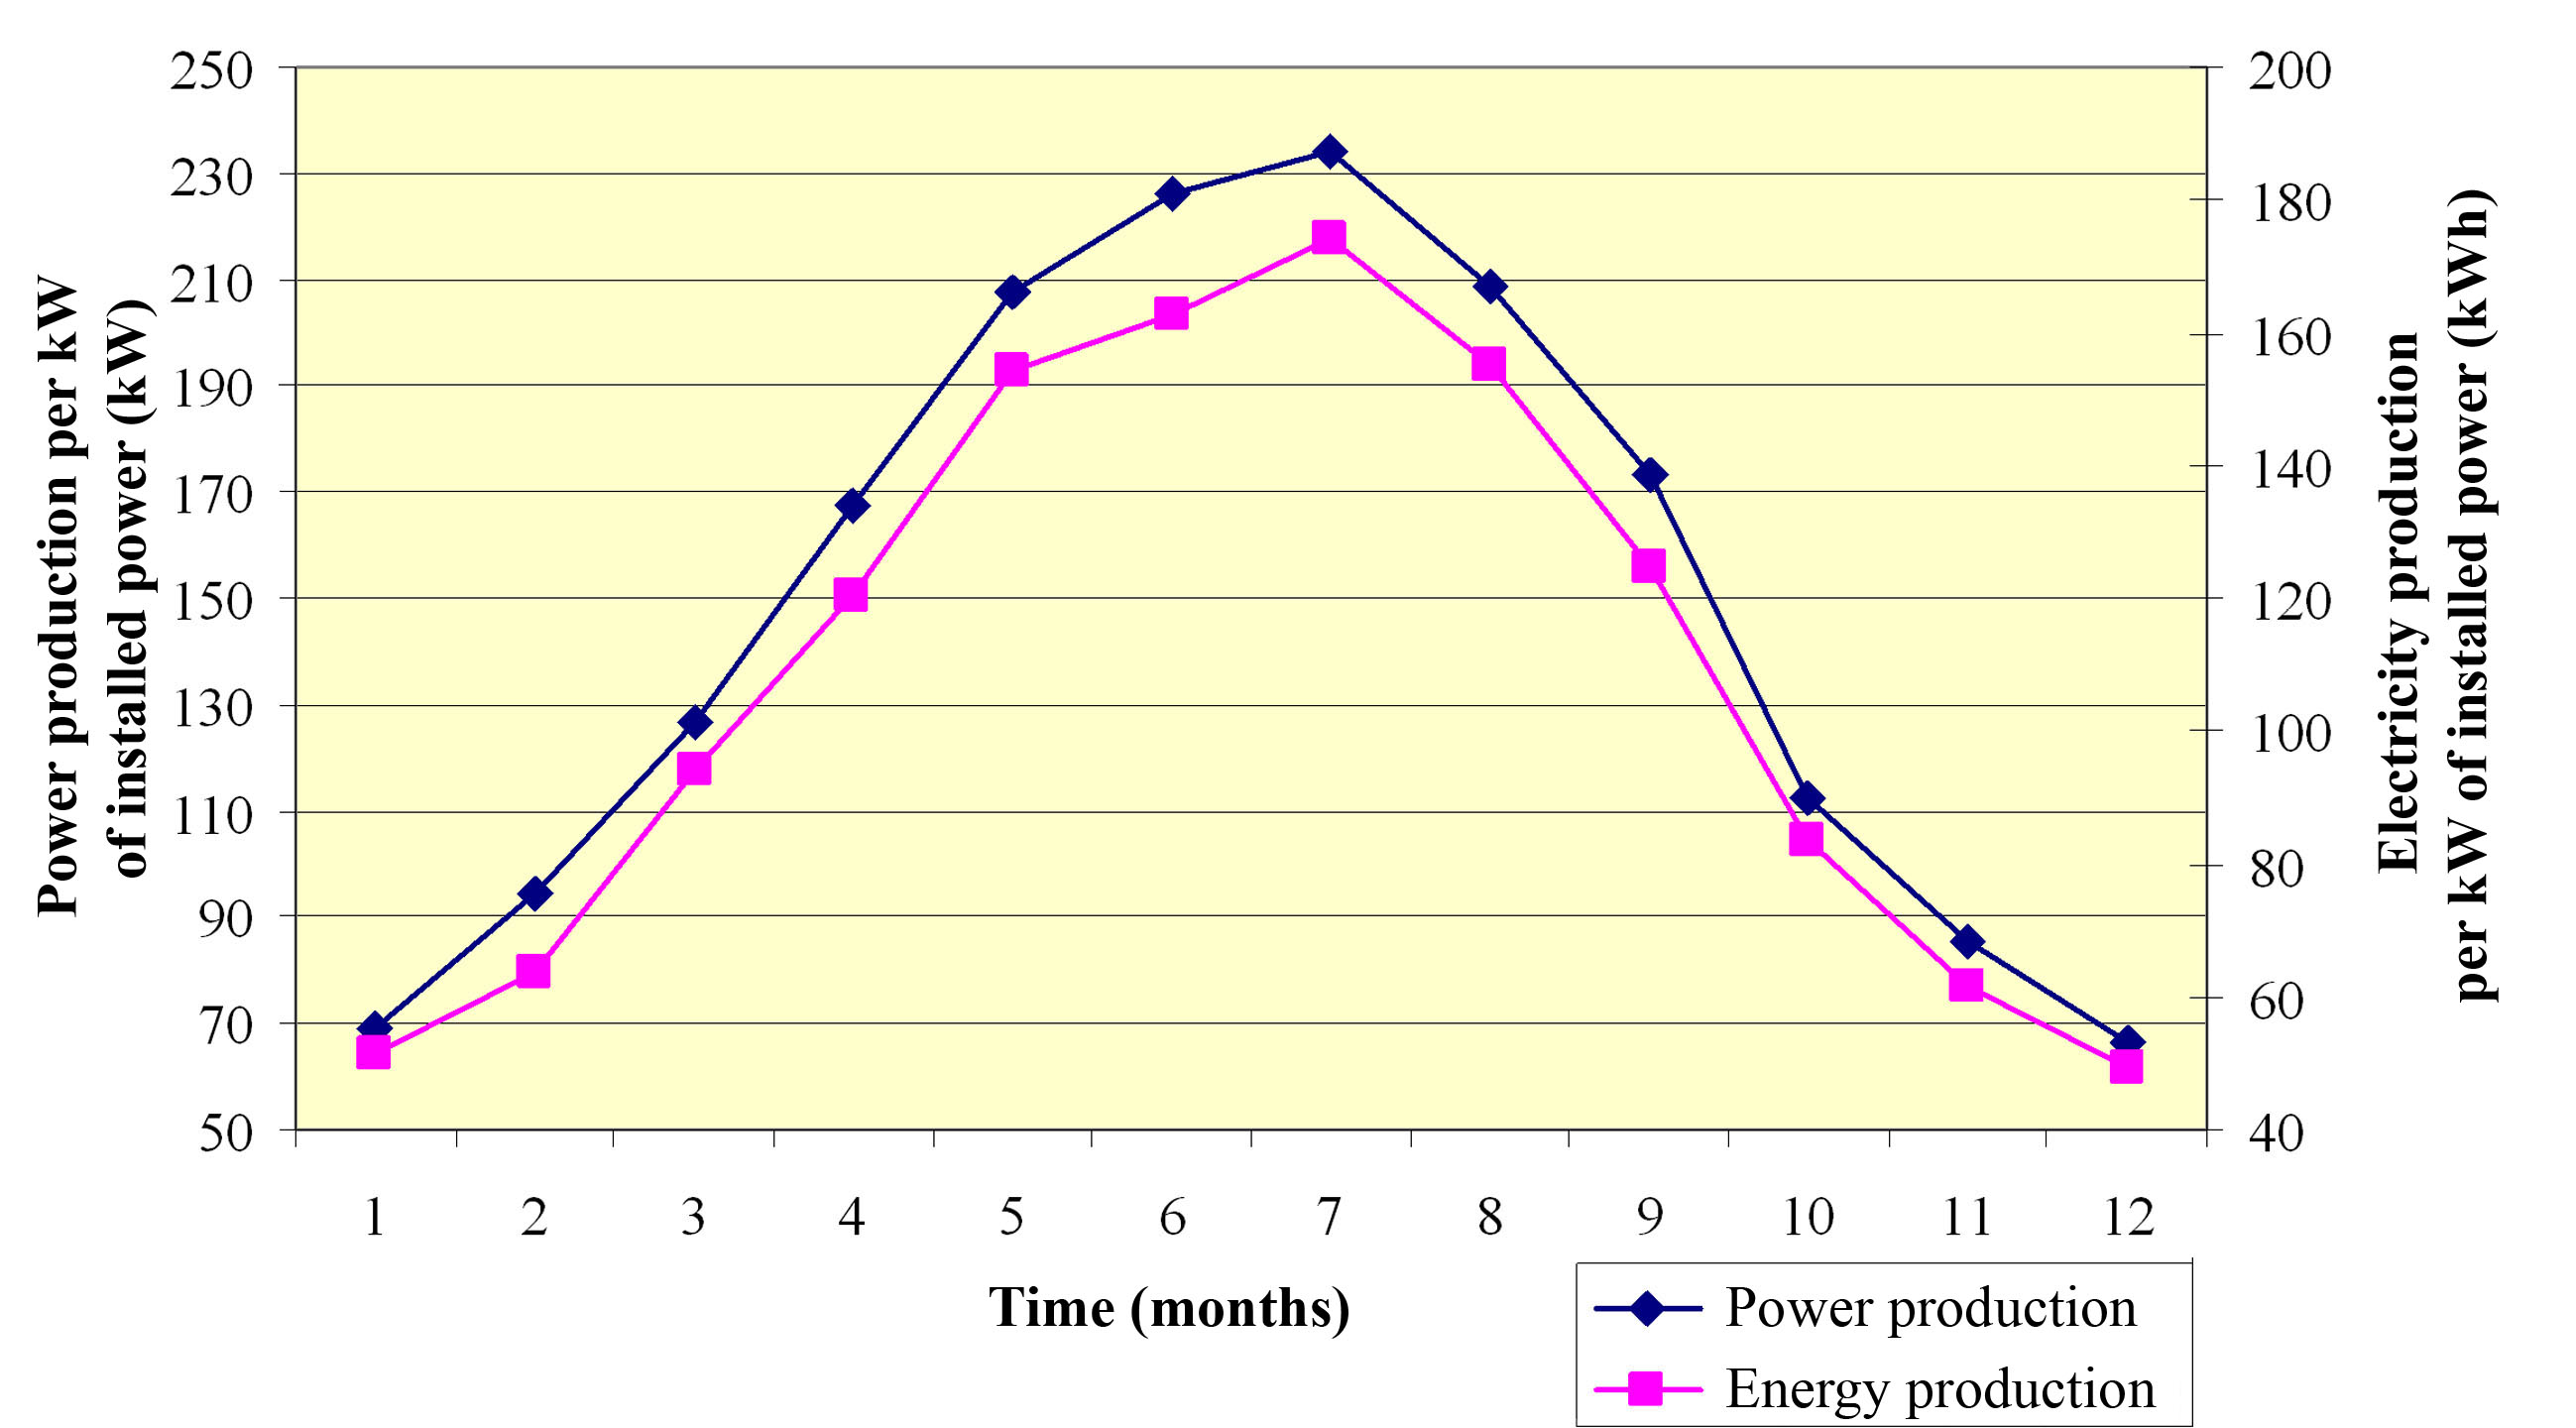
Figure 4: Annual variation of electricity and power production from the photovoltaic station.
In figure 3 it is observed that the photovoltaic station’s efficiency is maximized during the winter period. This is because the photovoltaic cell’s temperature approaches the standard operating conditions temperature of 25οC, hence the efficiency PRT increases.
Nevertheless, in figure 4 that the electricity and power production from the photovoltaic station are maximized during summer period, obviously due to the higher available solar radiation.