The wind power is reduced from physical or technical obstacles such as trees, buildings etc. The effect of an obstacle on the wind power can be extended two-times the obstacle’s height towards the vertical direction and 20-times the obstacle’s height towards the wind blowing direction (see figure 1). If a wind turbine is located inside the affected area from an obstacle, the available wind power on the wind turbine’s rotor will be lower than the available one before the obstacle. This phenomenon is called wind turbine’s shading. The affected area behind an obstacle is called wake.
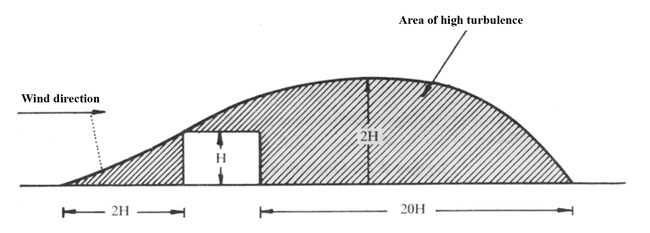
Figure 1: The effect of an obstacle on the wind power [1].
Inside the wake of an obstacle, the wind flow exhibits high turbulence and reduced kinetic energy (see figure 2). Except the reduced available wind power inside this area, the turbulent flow may cause important fatigue on the turbine’s blades that may lead even to rotor’s destruction. The micro-siting of the wind turbines, namely the exact determination of the turbines’ installation positions inside the wind park’s site, should take into account all the existing obstacles in the vicinity of the wind park, in order to avoid the shading effect.
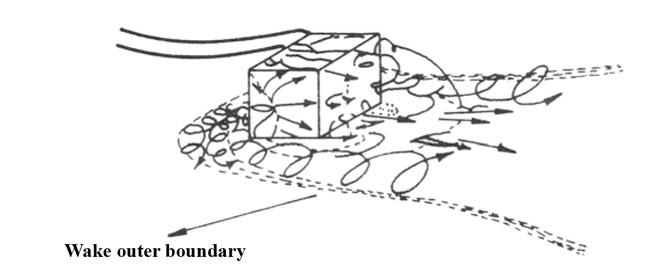
Figure 2: The development of the wake behind an obstacle [1].
A wind turbine’s shading can be caused from other wind turbines of the wind park as well. The rotor of a wind turbine captures part of the available wind kinetic energy and converts it to electricity. Behind the wind turbine’s rotor the wind kinetic energy is reduced approximately to 1/3 of the available one in front of the rotor. The area behind the wind turbine’s rotor, where the wind kinetic energy is lower, is called the turbine’s shading area. The width of the shading area increases with the distance from the turbine’s rotor. The wind velocity inside the shading area increases gradually with the distance from the turbine’s rotor as well. The wind kinetic energy is fully restored after a distance of 20 times approximately the rotor’s diameter towards the wind blowing direction (see figure 3).
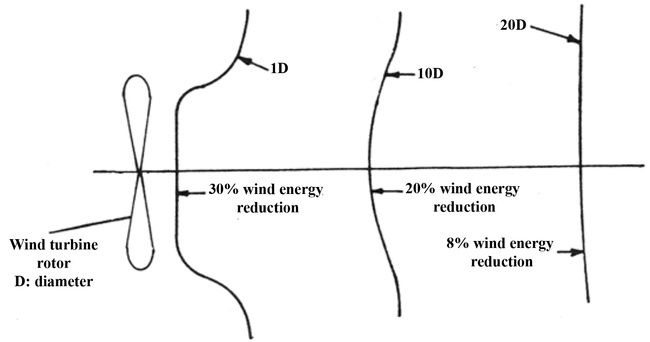
Figure 3: The development of the shading area behind the rotor of a wind turbine [1].
The percentage of the wind energy reduction over the available wind energy in the front of the rotor is called shading loss. A total annual shading loss of 5% in a wind park means that the total annual electricity production from all the wind turbines of the wind park will be equal to the 95% of the maximum annual electricity production from the wind turbines, in case there is not any wind energy reduction due to shading losses between the wind turbines or other physical or technical obstacles. The shading losses in a wind park depend on:
The proper micro-siting of the wind turbines takes into account the above three parameters and aims at the minimisation of the turbines’ shading losses. Before the micro-siting procedure, the areas presenting high enough wind potential inside the total site must be selected. It is obvious that, regardless the total available land, the wind turbines are installed in specific positions that exhibit high enough wind potential, in order to maximise the annual electricity production. The lower limit regarding the available wind potential of the installation positions is set according to the investor’s expectations. Once the acceptable areas, regarding the available wind potential, inside the total site are selected, the wind turbines’ micro-siting begins. The minimum distance between two wind turbines sited vertical to the wind blowing main direction should be at least 2.5-3.0∙D, where D is the rotor’s diameter. The minimum distance between two wind turbines sited parallel with the wind blowing main direction should be at least 7∙D, in case the available place in the installation site is limited (figure 4). In figure 4, the micro-siting in an offshore wind park is presented. In this case, the distance between two wind turbines in the same line is kept 5∙D.
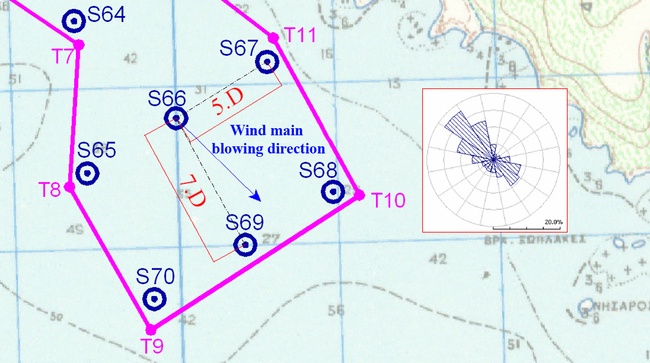
Figure 4: The micro-siting of wind turbines in lines vertical and parallel to the wind blowing main direction. The abbreviation S1, S2, … stands for wind turbines’ installation sites.
Some examples of wind turbines’ micro-siting are provided below.
In figure 5 the final micro-siting of seven wind turbines with nominal power 3,000kW and rotor diameter of 90m is presented, for a site in the southern Crete. In the same figure the wind-rose calculated from the 9-months wind potential measurements is presented. The wind turbines are installed in positions exhibiting mean annual wind velocity higher than 8m/s. The morphology of the mountain’s top enables the micro-siting of the wind turbines in a direction vertical to the wind blowing main direction. The abovementioned favourable conditions and the small number of the wind turbines lead to the minimisation of the calculated shading losses.
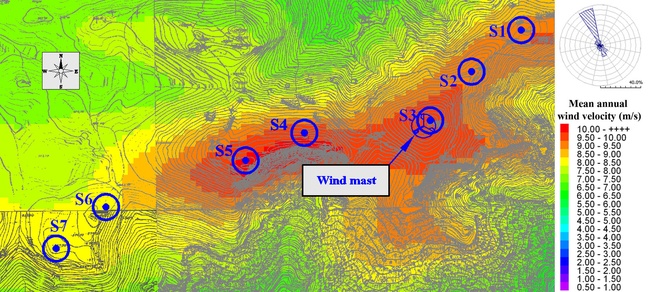
Figure 5: The micro-siting of a 21MW wind park in the island of Crete. The abbreviation S1, S2, … stands for wind turbines’ installation sites.
In figures 6 and 7, two alternative micro-siting scenarios of 12 wind turbines with nominal power 3MW and rotor diameter 90m are presented. In the same figure the wind-rose calculated from the annual wind potential measurements is presented. The number of wind turbines and the lack of available land restrict the possibilities for optimum micro-siting and minimisation of wind turbines’ shading losses. In the first micro-siting scenario presented in figure 5, the wind turbine S9 is sited inside the wake of the wind turbine S12 and the wind turbine S8 is sited inside the wake of the wind turbines S7 and S9, with regard to the wind blowing main direction. The wind turbines S8 and S9 exhibit 12.32% and 13.97% shading losses respectively.
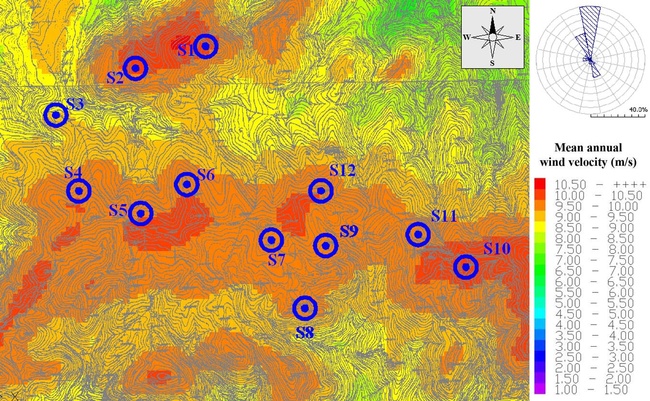
Figure 6: The micro-siting of a wind park in the southern Crete – first scenario. The abbreviation S1, S2, … stands for wind turbines’ installation sites.
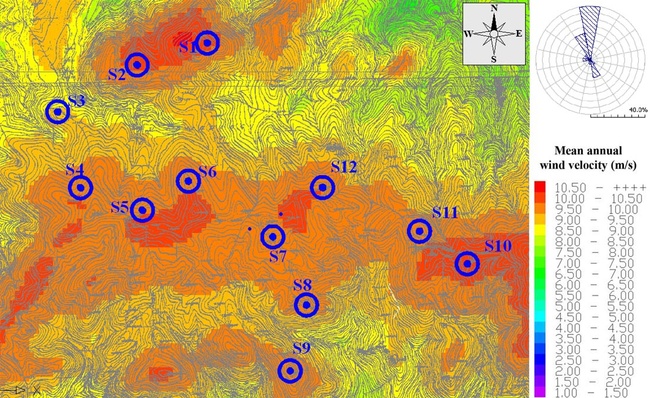
Figure 7: The micro-siting of a wind park in the southern Crete – second scenario. The abbreviation S1, S2, … stands for wind turbines’ installation sites.
Finally, in figure 8 the micro-siting of a large number of 5MW nominal power wind turbines with a diameter of 105m in an offshore wind park at the south west of the Greek island of Karpathos (south-east Aegean Sea) is presented. The wind turbines are sited in lines vertical to the wind blowing main directions. Each wind turbine is sited in the gap of the two wind turbines sited in front of it. The distance between two wind turbines of the same line is 5 D. The distance between two lines is 7 D. In this micro-siting scenario, the wind turbines shading losses percentages vary between 2.33% and 8.50%.
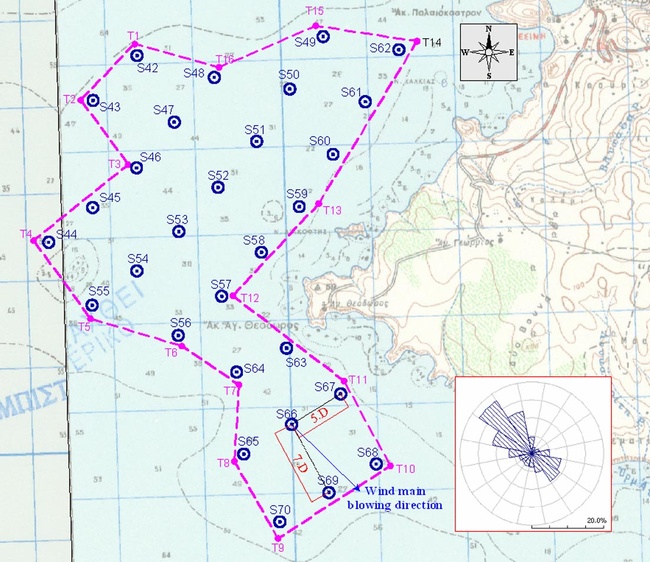
Figure 8: The micro-siting of an offshore wind park in the south west of the island of Karpathos (south east Aegean Sea). The abbreviation S1, S2, … stands for wind turbines’ installation sites.
The wind turbines’ micro-siting following the previously presented methodology is based only on the minimisation of the shading losses. This is the fundamental scope of the wind turbines micro-siting. The calculation of the shading losses is performed during the calculation of the annual electricity production from the wind turbines. This calculation is carried out on the basis of the captured wind potential measurements and the developed wind map on the installation site.
However, the maximisation of the electricity production from the wind park and the minimisation of the shading losses are not the only parameters taken into account during the wind turbines micro-siting. The possible impacts on the environment and human activities must be examined as well, especially the following ones:
In figures 9-12, the noise emission maps and sectional views from a small wind park’s operation in the nearby settlement is presented for two different scenarios concerning the micro-siting of the wind turbines. In the first scenario (figures 9, 10), the nearest wind turbine (S1) to the neighbouring settlement is 792m away. The noise level in the settlement is estimated at 43.5dB. In the second scenario (figures 11, 12), the abovementioned wind turbine does not exist. The nearest wind turbine (S2) to the settlement is now 1,045m away. The noise emission in the settlement is reduced at 41.8dB.
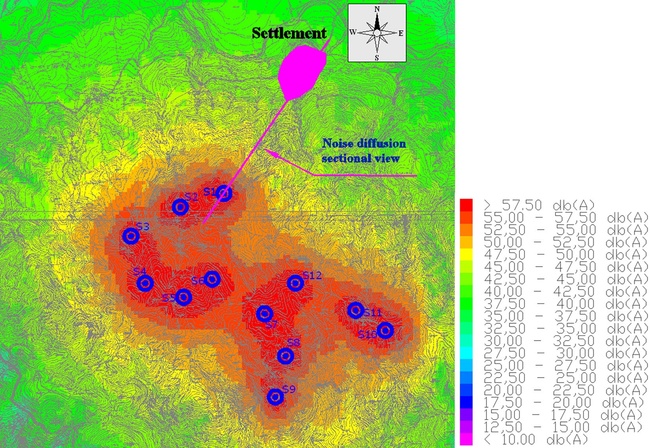
Figure 9: The noise emission map from the examined wind park with 12 wind turbines. The abbreviation S1, S2, … stands for wind turbines’ installation sites.
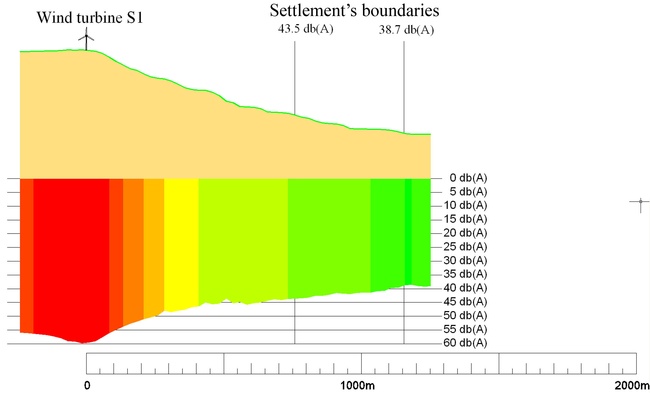
Figure 10: The sectional view of the noise diffusion from the examined wind park with 12 wind turbines to the nearby settlement.
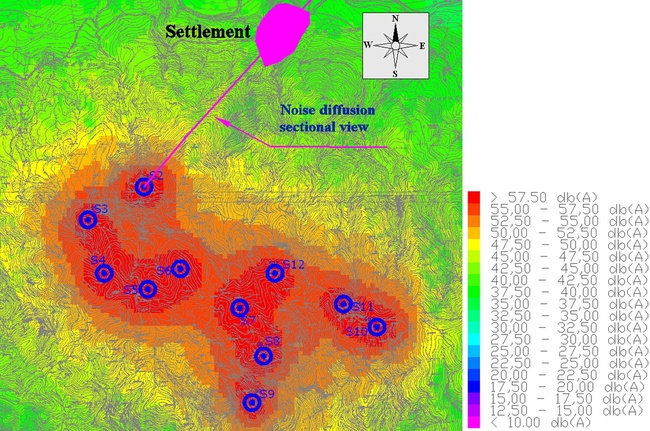
Figure 11: The noise emission map from the examined wind park with 11 wind turbines (without the nearest wind turbine to the settlement). The abbreviation S1, S2, … stands for wind turbines’ installation sites.
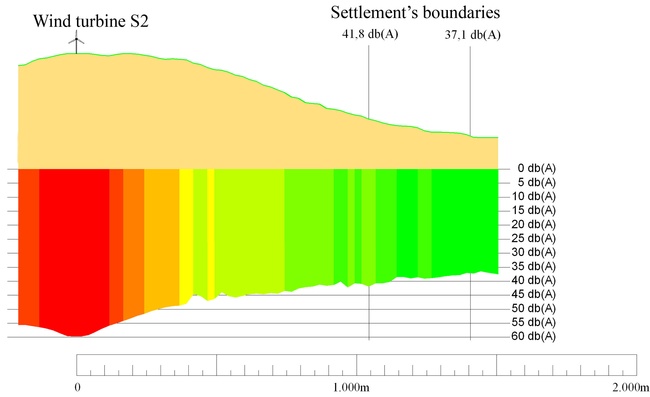
Figure 12: The sectional view of the noise diffusion from the examined wind park with 11 wind turbines to the nearby settlement.
An example concerning the visual impact of a wind park in a nearby tourist destination is presented in figures 13a and 13b. The examined wind park is the one presented in figure 4, consisting of seven wind turbines, giving a total nominal power of 21MW. In figure 13a the photorealistic representation of the wind park from the southern coast of Crete, approximately 4,000m away from the wind park, is presented. As seen in figure 13a, there is a slight visual contact between the wind turbines S2 and S3 (see also figure 4) and the coast. If these turbines are removed, the visual impact from the wind park to the coast is eliminated (figure 13b).
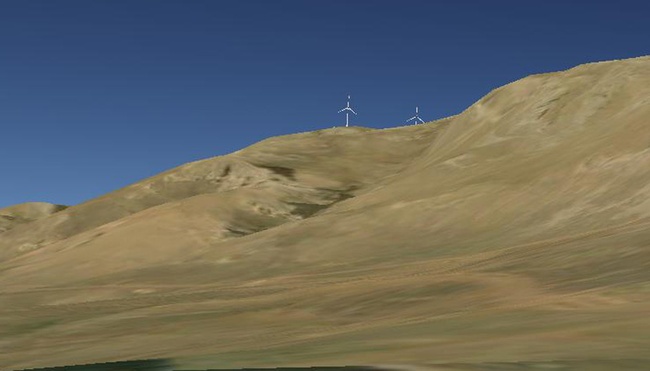
Figure 13a: Photorealistic representation of a wind park from the southern coast of Crete.
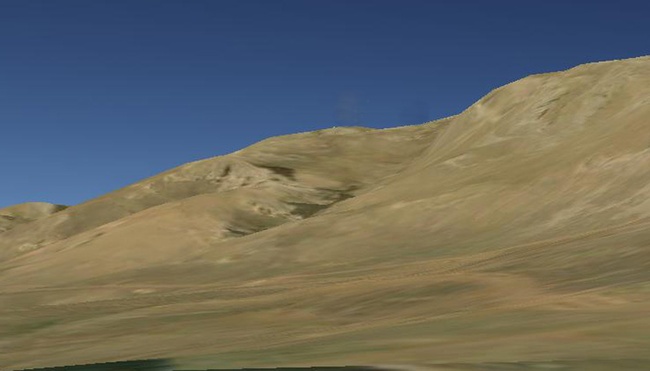
Figure 13b: The same with the previous figure view, after the removal of the wind turbines S2 and S3.
Except the possible impacts from the operation of a wind park, several other special issues, such as the minimum distances from the site boundaries, the elimination of the shear effect, the foundation of the wind turbines in grounds with geological peculiarities etc, can effect the micro-siting of the wind turbines.
With the above presented examples it is shown that the micro-siting of the wind turbines in a wind park is a multi-parameter procedure, although the minimisation of the shading losses and the maximisation of the produced electricity is the main goal.
References
[1] Bergeles G. Wind Converters., Simeon, Athens, 2005.