The term “power quality” is used in the scientific and technical field, to describe the produced power compatibility to the electrical devices requirements and standards. The power quality is analysed in two components:
Power quality is defined as the combination of voltage and current quality. In alternating power production systems, only the voltage and the frequency can be controlled. No control over the current that particular loads might draw may be achieved. Moreover, voltage quality is characterised as an overall phenomenon, referred to a considerable part of a utility network. On the other hand, current quality is a local phenomenon, configured by localised loads, and cannot constitute an objective index for the power quality evaluation of a power system.
A new methodology has been introduced for the evaluation of the electrical grids power quality, which aspires to constitute a universally acknowledged and certified procedure. The power quality evaluation new algorithm is based on the definition of a robust and mathematically clear criterion, the so-called “Power Quality Measure”, introduced in the following published article:
Katsaprakakis, D. Al., Christakis, D. G., Zervos, A., Voutsinas, S. A power-quality measure. IEEE Transactions on Power Delivery. 23 (2), pp. 553-561.
The Power Quality Measure (PQM) is calculated for every AC low voltage cycle. For this purpose, low voltage measurements are captured continuously with high sample rate, which enables the detection of power quality disturbances of high frequency, such as transients, harmonics, voltage flickering, voltage sags etc. The power quality measure is defined with the following relationship:
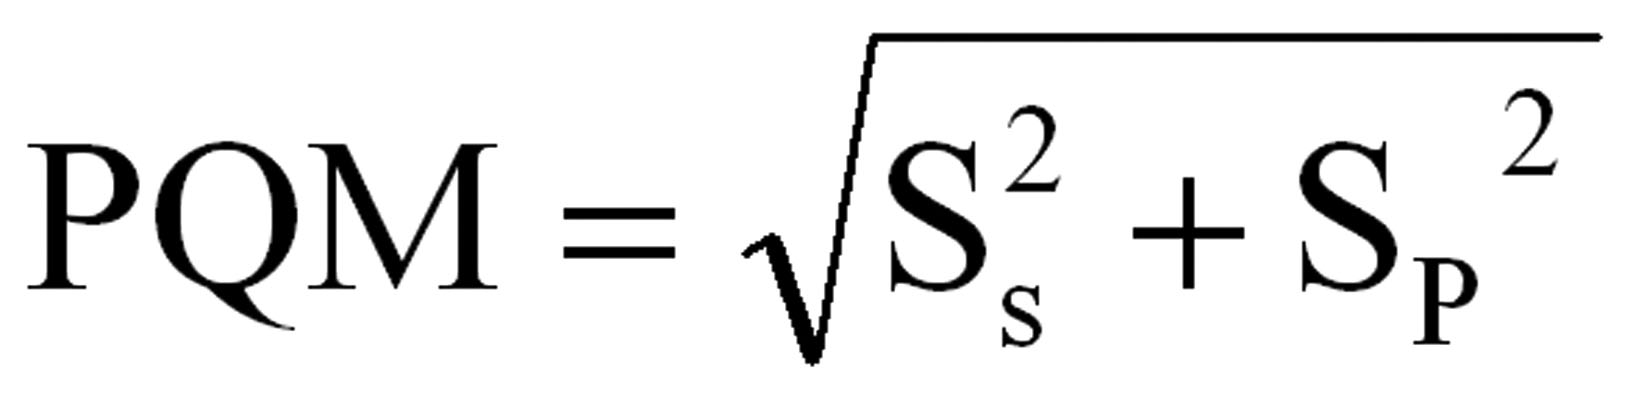
where:
The spectral component detects the measured voltage cycle frequency deviations, while the probabilistic component detects the measured voltage cycle magnitude deviations.
The introduced power quality measure expresses the deviation of the examined voltage cycle from the ideal one. The power quality at a network point is evaluated through the measured voltage cycles examination during predetermined time periods. The power quality of a utility network may be evaluated by the examination of voltage cycles power quality in properly selected network nodes.
The proposed power quality measure can be represented graphically in a 2D diagram, by introducing a 2D Cartesian coordinate system and depicting the spectral component in the horizontal axis and the probabilistic component in the vertical axis. The power quality measure will be represented in the coordinate system first quadrant. The distance of a first quadrant point from the coordinate system origin will correspond to a voltage cycle power quality with spectral and probabilistic components equal to that point coordinates (figure 1).
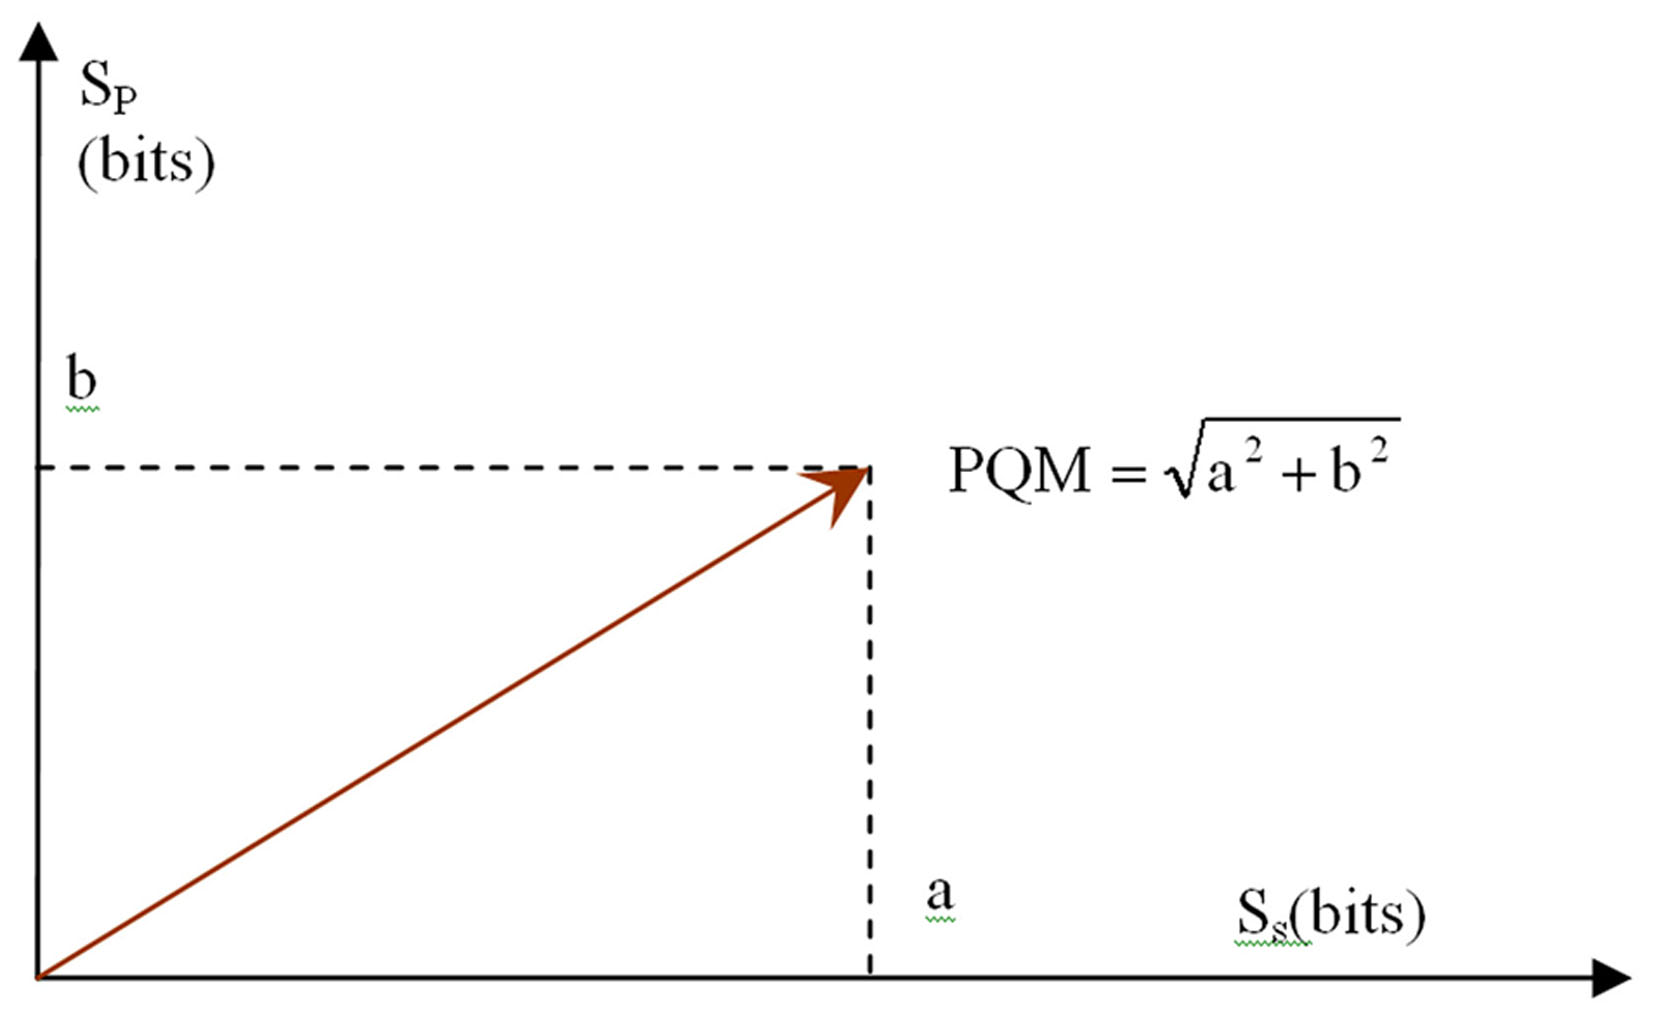
Figure 1: Graphical representation of the power quality measure.
The following properties stand for the defined measure:
Three laboratory prototypes were developed for the application and the evaluation of the introduced methodology. The power quality measure was calculated for several real or technically created power quality disturbances. The results are presented in figure 2. The orthogonal shape defined by the dashed lines determines the area of acceptable power quality measures. This area was determined approximately with the lines SP=2,5 bits and SS=2,5 bits. Since the consequences of power quality disturbances may vary on different customers, these limits may vary too.
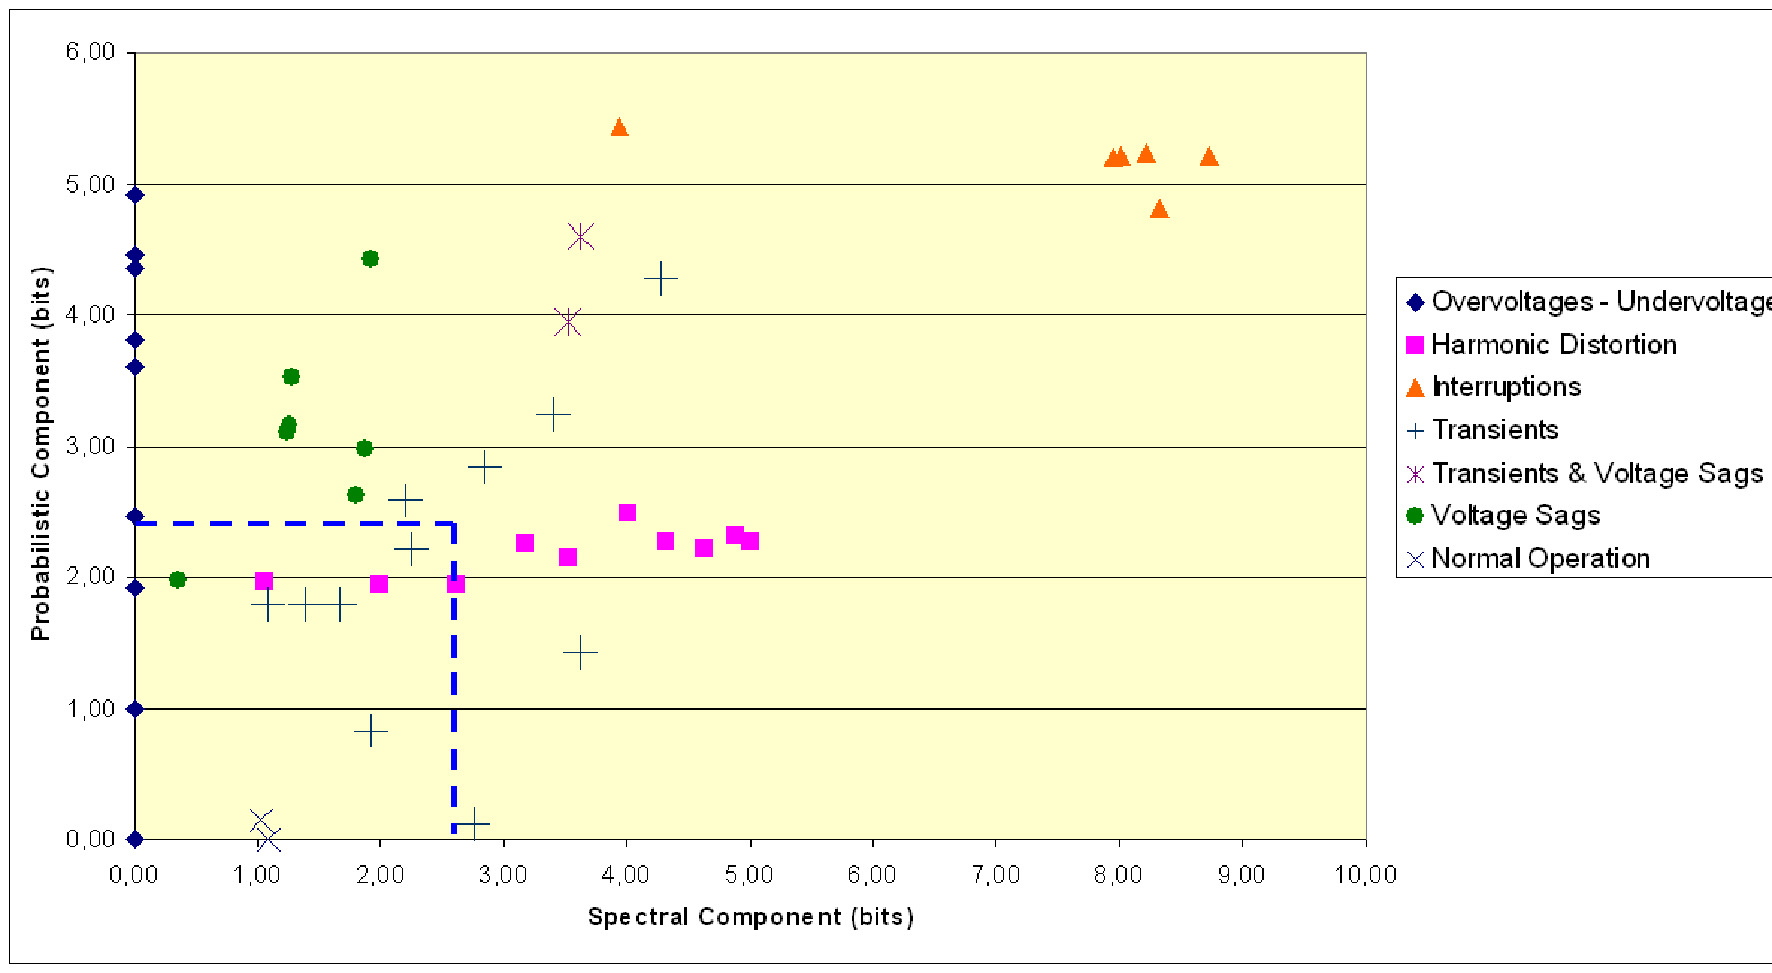
Figure 2: The power quality measures graphical representation of the examined voltage cycles.
The developed measuring devices consist of common PCs equipped with data acquisition cards and a voltage divider designed especially for this purpose. The necessary software was developed on the LabVIEW platform. An external voltage magnitude regulator device was connected serially to the voltage divider, in order to control the captured sine wave magnitude and produce the power quality disturbances as desired. The constructed software detects the faulty voltage cycles, according to the maximum acceptable value for the power quality measure, introduced as a software parameter. The faulty voltage cycles are stored in the PC hard disk. A characteristic screen of the developed application is presented in figure 3.
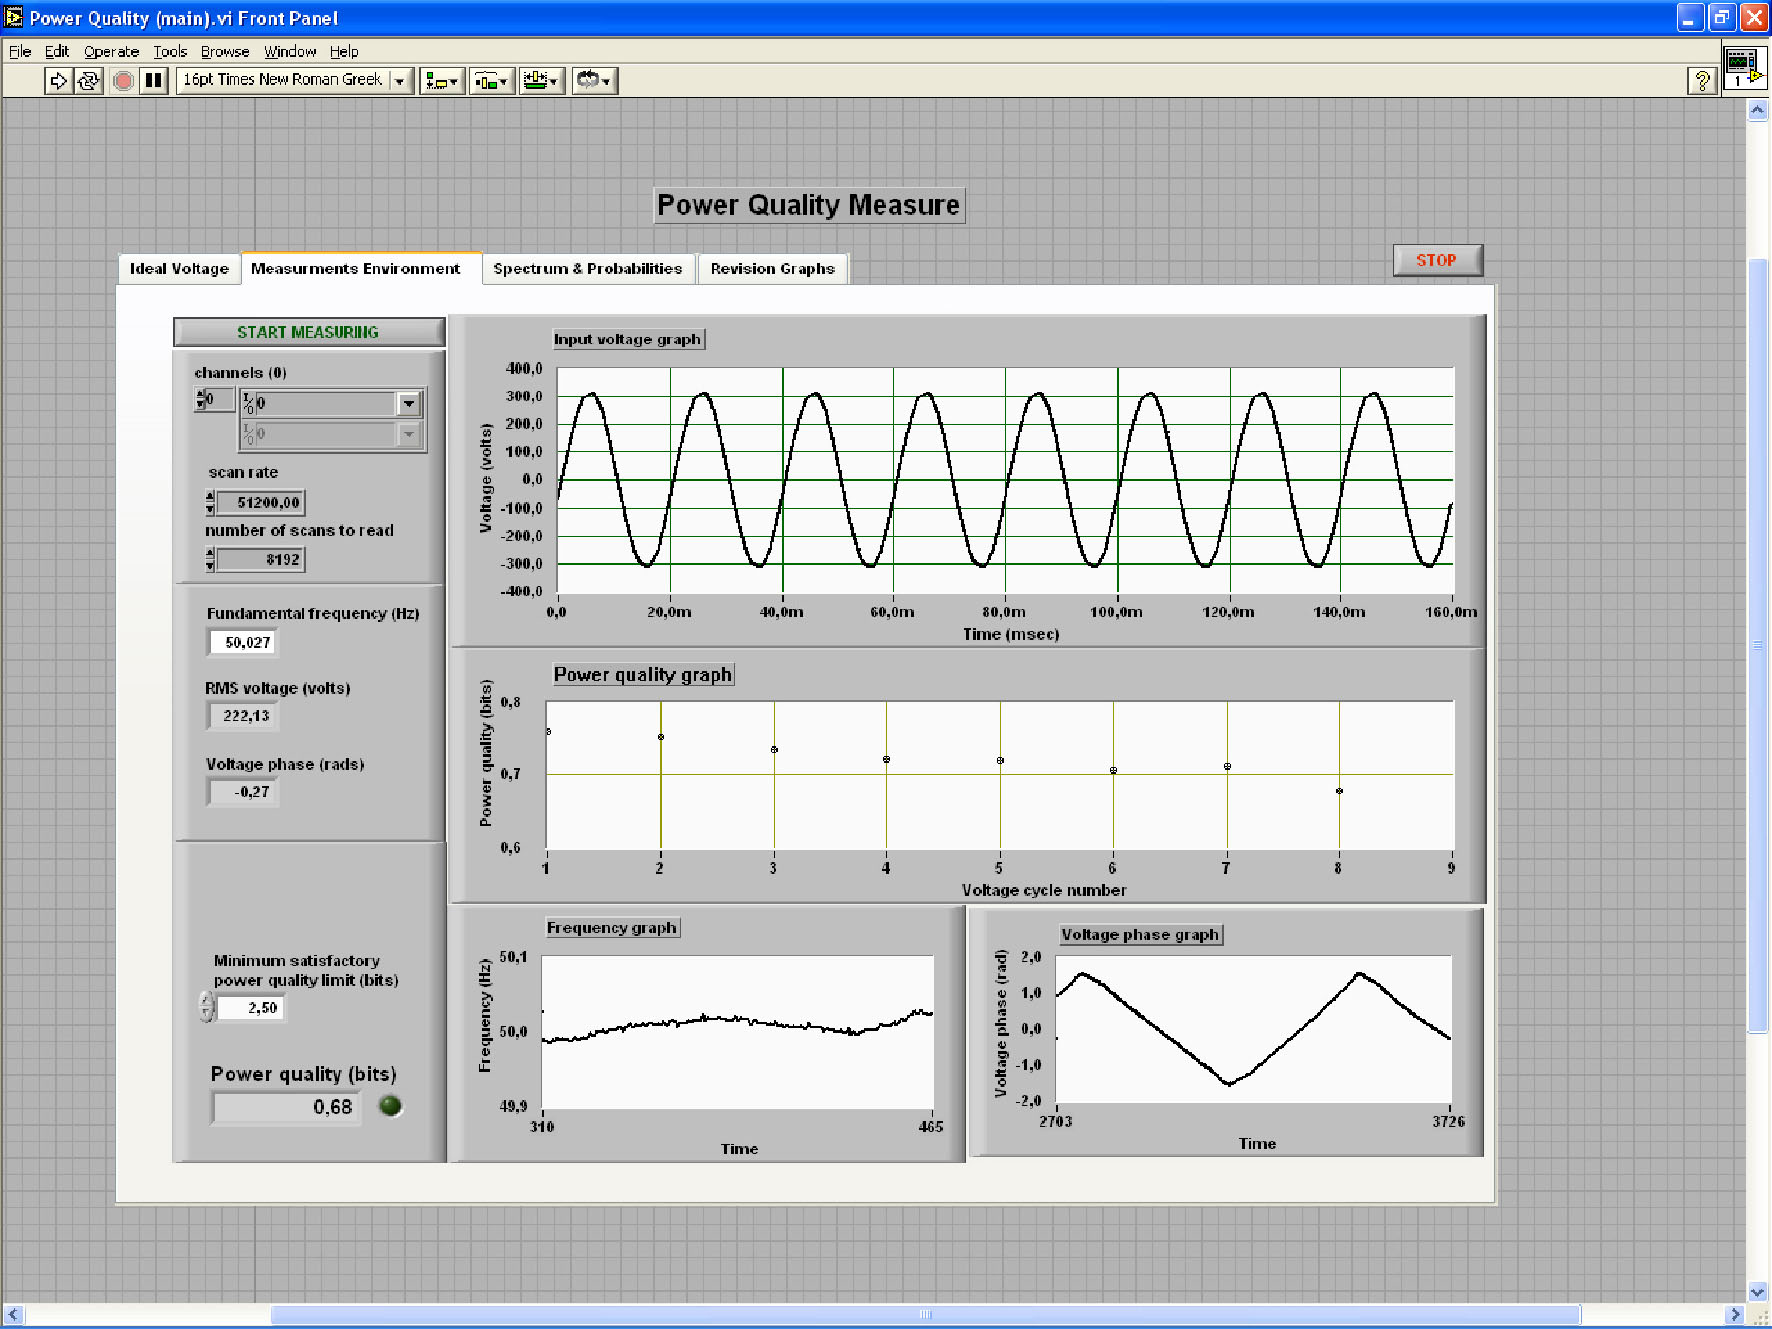
Figure 3: Real-time power quality measurements presentation.
So far, the power quality measure mathematical background is fully defined and the introduced methodology has been checked by the construction of laboratory prototypes, while in figure 2 it is illustrated that the introduced power quality measure succeeds to detect and classify respectively all the examined power quality disturbances. The next step is the development of a commercial handy device, with much smaller size (as compared to a common PC) that will ensure portability, user friendliness and affordable price for the mean household.